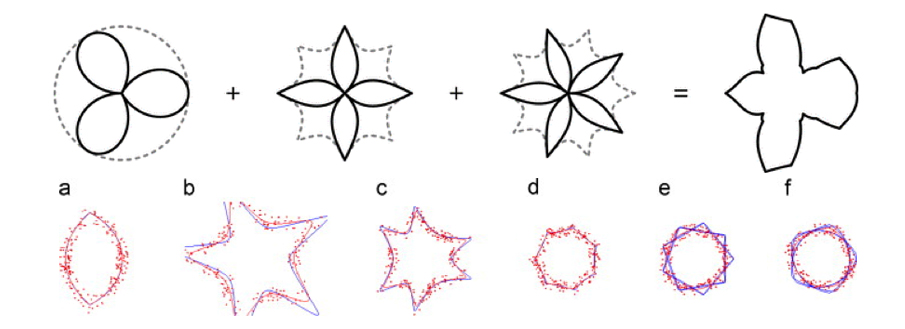

Visualization of data is a practical and useful approach to empower humans to make sense of data, grasp patterns and make decisions. At the same time, computing and artificial intelligence profit from the same transformation, data to shapes, as well as the other way around, shapes to data.
By translating visual expressions and designs into supershapes and parametersets thereof, the computer can run a similarity analysis that renders the currently used methods obsolete, while giving instant access to related information for a fraction of the cost. On top of that, the computer can interactively suggest designs, patterns and variations that stay clear of any undesired areas.
TRANSFORM DATA INTO SHAPES
Another application is to transform data, let’s say written text, into shapes. That can be achieved using various approaches and, depending on the goal of the transformation, the appropriate one can be chosen. Text could be represented as a pattern of black and white dots, or supershapes describing the path through the alphabet, for data compression. Or it can be transformed into supershapes to let the computer detect similarities and dissimilarities between written artifacts that go beyond word-for-word or sentence-for-sentence comparisons.